SPUN Fungal Network in Science: Embedding the Map, Deriving a Score — and What Millions of Tons of Substrate Teach Us
Deep dive into the global mycorrhizal map (Science 2026): SPUN embedding, FungiFind score, carbon flow vs. storage — and why cultivation sets the scale…
When the first global map of arbuscular mycorrhizal networks appeared in Science (Stewart et al. 2026, DOI 10.1126/science.adu4373), it was more than a headline for many mycologists and cultivators: finally, dimensions could be named that one feels daily in the lab and in the facility, but could never quantify on this scale. Those of us who operate fungal systems at industrial scale — substrates in millions of pounds, waste that becomes food, medicine, and soil — see in the numbers a confirmation: Efficiency lies in the organism. This article delves into the study, technically examines whether SPUN's map can be embedded in FungiFind, and honestly explains whether it can be used to derive find probabilities for our score model.
> Summary: The SPUN map cannot be embedded via iframe (same-origin protection). For the FungiFind score, it is not directly usable — it measures underground AM infrastructure, not fruiting-body weather. Thematically closer is the EcM biodiversity layer in the Underground Atlas. For a detailed overview of the study, see our article from July 2026.
What the Science study really measures
Justin D. Stewart and colleagues modeled the hyphal density and biomass of arbuscular mycorrhizal fungi (AM, phylum Glomeromycota) in the top 15 cm of soil. Basis: over 4,000 measurements from more than 16,000 soil samples, supplemented by random forest models that map environmental variables (climate, vegetation, topography, soil, land use) onto 1-km² pixels.
The central magnitudes — scientifically verified and often simplified in media:
| Metric | Value | Classification | |----------|------|------------| | Hyphal length (AM, top 15 cm) | ~110 quadrillion km (1.1 × 10¹⁷ km) | Underground network of planetary scale | | Living AM biomass (C) | ~300 Mt | Multiple of human biomass | | Annual carbon flow plant → AM | ~1 Gt C/year (~3.9 Gt CO₂-eq.) | ~11% of fossil emissions — flow, not permanent storage | | Cropland vs. wild | ~50% less AM density on cropland | Agriculture halves a central soil network |
Important: The often-cited "4 billion tons of CO₂" refers to the annual carbon flow into the networks — comparable in magnitude to human emissions, but not to be equated with a fixed carbon pool. Part is released back through respiration, part contributes to long-term humus formation. Those communicating climate impact should separate flow, storage, and residence time — otherwise, the impression of a simple CO₂ sink arises, which AM fungi are not.
SPUN additionally provides the Underground Atlas: alongside AM hyphal density, also mycorrhizal biodiversity (AM and ectomycorrhizal/EcM) with predictions for species richness and endemism per 100 m² within 1-km² pixels — trained on 2.8 billion DNA sequences from 25,000 soil samples (Nature 2025, Van Nuland et al.).
From substrate basin to planet: What cultivation and wild soil have in common
Those who scale fungi in substrate systems — be it shiitake on wood, oyster mushrooms on straw, or mycorrhizal inoculant for agriculture — see the same logic on a small scale: hyphae transform substrate, bind water, stabilize structure, store and conduct nutrients. In facilities with over a million pounds of produced substrate, it becomes visible how efficiently fungi turn waste into usable biomass — waste into food, into medicine, into soil.
The Science map sets exactly this efficiency into global relief: 110 quadrillion kilometers of living threads, continuously active, mostly invisible. The contrast to cropland is brutal: the practices that feed eight billion people have, according to model calculations, destroyed or weakened about half of the AM network density — plowing, mineral fertilization, fungicides, monocultures. This is not a moral judgment on agriculture, but a trade-off: short-term yields against long-term soil infrastructure, nutrient cycles, and carbon dynamics.
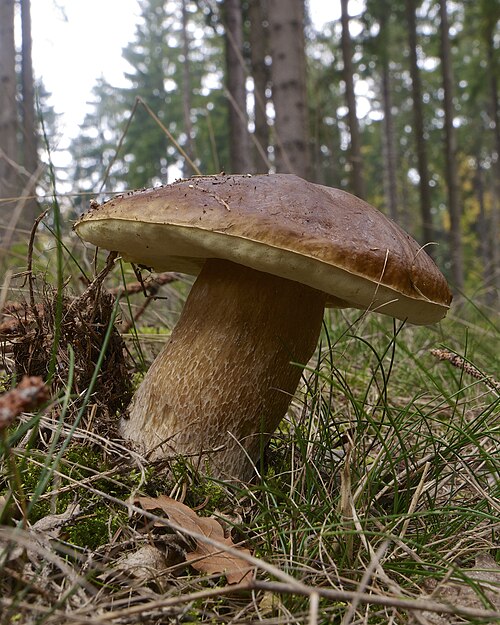
For mushroom enthusiasts, this means: healthy forests and meadows are not just "beautiful," they are substrate-like habitats for those fungi we seek in our baskets — especially ectomycorrhizal species like porcini (Boletus edulis) or chanterelle (Cantharellus cibarius). AM fungi themselves form no visible fruiting bodies; they are the invisible backbone of grasses, cereals, and many wild plants.
Can the SPUN map be embedded in FungiFind?
Technically tested (August 2026): The interactive map at spun.earth/underground-atlas/mycorrhizal-biodiversity sends the HTTP headers X-Frame-Options: SAMEORIGIN and Content-Security-Policy: frame-ancestors 'self'. This means: embedding via iframe on fungifind.org is blocked — a deliberate security and branding decision, not a technical gap.
What SPUN offers instead:
- Deep link to the Underground Atlas (AM infrastructure, EcM/AM biodiversity, hotspots, protected areas)
- Data download and contact for collaborations ("Contact us to discuss collaboration opportunities or learn more about using these data")
- Map technology via Felt APIs — no public embed widget documentation for third parties
Recommendation for FungiFind: Instead of an iframe, a prominent link card in the blog and optionally a "Open Underground Atlas" button in articles on mycorrhizal research. Legally and technically clean, respects SPUN's platform. A real integration would only be conceivable via licensed raster data (GeoTIFF/COG) and custom map layers in the FungiFind map — that would be a separate collaboration project with SPUN, not a one-liner.
Can one derive a find probability for the FungiFind score from the map?
Short answer: No — not directly, and not for AM data. Here is the detailed reasoning.
What the FungiFind score measures today
The score on the FungiFind mushroom map is a fruiting-body prediction model for specific species (e.g., porcini, chanterelle, morel). Per day and location, we multiply factors:
- Season (day of year vs. species-typical window)
- Temperature (10-day average, species-specific thresholds)
- Moisture / precipitation (14-day sum, water balance, rain lag)
- Region (biogeographic weighting)
- Elevation (species-typical elevation preference)
- Habitat (CORINE land cover: deciduous forest, coniferous forest, meadow, cropland …)
The result is a relative probability 0–1 of when and where conditions for fruiting-body formation of a species fit — not for soil DNA diversity or hyphal density.
Why AM hyphal density doesn't fit
- Different organisms: AM fungi (Glomeromycota) ≠ edible forest mushrooms (mostly Basidiomycota, EcM or saprotrophs).
- Different timescale: Hyphal density is structural and long-term; fruiting bodies depend on weather of the last days/weeks plus season.
- Different spaces: Highest AM densities are often in grasslands (Tibet, prairies) — not where porcini hunters typically search.
- No fruiting bodies: AM do not form basket-filling mushrooms; a high AM score says nothing about Boletus fruiting bodies visible tomorrow.
What would theoretically be closer: EcM biodiversity
SPUN's EcM richness and endemism layer (1 km², species/100 m²) describes more the world of forest mushrooms — but still soil diversity, not fruiting event. Correlations exist (intact forest → more EcM → better conditions for mycorrhizal partners), but:
- Resolution 1 km² is too coarse for "over there at the corner"
- Model gives species richness, not "porcini today"
- Uncertainty zones (CV, extrapolation) are large — SPUN explicitly marks this
Possible future (soft factor, not score replacement): An optional ecosystem health note ("EcM richness: high/medium/low, model SPUN v1.0") as context alongside the weather score — at most slight weighting, clearly as soil quality, not find guarantee. This would require licensed tiles or API access.
The cropland 50% finding and our habitat gate
Indirectly, the study touches FungiFind: cropland has poorer AM networks. Our habitatGate already strongly reduces for many edible mushrooms on cropland (group gate ~0.1–0.3 vs. deciduous forest ~0.9). This is ecologically consistent, but comes from species-habitat preferences, not SPUN raster data. The maps are parallel, not redundant.
Research context: Two SPUN maps, two questions
| Map | Question | For foragers | |-------|-------|-------------| | A Hidden Infrastructure (Science 2026) | How much AM hyphal mass and carbon flow? | Climate, soil, agriculture — not find locations | | Underground Atlas Biodiversity | Where is mycorrhizal species richness high? | EcM layer thematically closer, but not a fruiting map |
Both complement the FungiFind map, not replace it. FungiFind answers: "When does my porcini score light up green?" SPUN answers: "How dense and diverse is the underground network on the planet?"
Conclusion: Quantify what you feel — and stay honest
The Science publication gives the anecdotal knowledge from cultivation and field research a global measuring tape: 110 quadrillion kilometers of hyphae, a carbon flow on the order of a large part of fossil emissions, and half the network density on cropland — while we simultaneously feed eight billion people. The efficiency of turning waste into value is inherent in fungi; the global map shows how little of it we still use in industrialized agriculture.
For FungiFind, this means: Link instead of embed, score remains weather- and habitat-based, and AM data belongs in climate and mycology articles — as in our July article on the world map and in the climate change context. Those who go foraging today open the mushroom map with weather and species — those who want to understand the world under their feet, the Underground Atlas from SPUN.
Note: This article was editorially created and checked against primary sources (Science, SPUN, FungiFind scoring code). It serves general information. Never identify and consume mushrooms solely based on apps.
Sources & further reading
- Stewart et al. (2026): Global density and biomass of arbuscular mycorrhizal fungal networks — Science, DOI: 10.1126/science.adu4373 (research)
- SPUN — Underground Atlas: Mycorrhizal Biodiversity Map v1.0 (research)
- SPUN — A Hidden Infrastructure (Science 2026 infrastructure map) (research)
- Van Nuland et al. (2025): Global hotspots of mycorrhizal fungal richness are poorly protected — Nature (research)
- FungiFind Blog — Globale Weltkarte der Mykorrhiza-Pilznetzwerke (Juli 2026) (news)